
Organizations focused on Environmental Social Governance (ESG) need to disclose their ESG data periodically by publishing ESG reports. In this guide we’ll define the types of ESG reports along with tips for when and how to compile them. Numerous ESG report examples are included for inspiration along with a best practices checklist and ESG reporting award sites.
Table of Contents
ESG reporting is the public disclosure of corporate environmental, social, and governance data. ESG reports (also referred to as ESG disclosures or sustainability reports) provide detailed summaries of ESG goals, progress and risk management, as well as ESG’s respective impact on business financials or broader society and environment.
Reporting allows companies to publicly share their ESG strategy in detail and how they plan to minimize ESG risks and fulfill ESG goals.
ESG reporting is important for keeping stakeholders informed and complying with disclosure regulations.
When ESG data is NOT communicated, it can result in erroneous assumptions being made… Is the company hiding something? Are risks properly being mitigated? Is the company being socially and environmentally responsible? Unanswered questions leave gaps for interpretation that can have significant consequence for company PR and investment value.
Bottom line, transparent ESG reporting makes your company more attractive to investors, business partners, employees, and customers.
Various types of ESG reports are used depending upon report audience, disclosure regulation requirements, or stage of ESG journey. Companies might use one or all of the following report formats:
ESG assessment reports help compare current state versus desired state performance while serving as a potential benchmark for peer comparison.
Assessments can be performed in-house (e.g., ESG materiality assessment) or online via popular ESG frameworks like:
Assessments are typically both resource and time-intensive to complete. However, the resulting reports are instrumental for guiding ESG strategy and understanding how your company compares to peers in respect to its country location, industry and size for ESG performance. Management and stakeholders often appreciate the simple, structured format of ESG assessment reports and the bottom-line actionable status or score.
ESG assessment reports are used early in the ESG journey, so as to inform gaps and adjust strategy to better align results with goals. Most companies conduct assessments annually.
In contrast to publicly-shared reports, you’ll also need to report in-house on ESG initiatives to keep employees and management appraised on progress. There’s no fancy process or template for this type of reporting. When ESG is integrated into corporate strategy, projects relevant to ESG simply follow traditional status update and reporting procedures like any other project.
ESG standalone reports (also referred to simply as ESG reports) are created by the company to communicate the full scope of their ESG efforts. Similar to an annual financial report, these are typically lengthy and highly detailed. An ESG standalone report’s primary purpose is to focus on material issues that demonstrate the relationship between ESG and business strategy.
See examples below for: Trane Technologies ESG Report, Coca-Cola ESG Report, DFW Airport ESG Report and more.
Integrated annual reports (also known as “integrated reports”) incorporate ESG or sustainability data with annual financial reporting data. Corporations discuss ESG initiatives and impact alongside their finances, annual activities and future objectives. The ESG data found inside these reports is often less detailed than what would be included inside an ESG standalone report.
*This approach is recommended for experienced ESG companies that have already successfully published their first ESG standalone report.
See examples below for: Bank of America ESG Integrated Annual Report, Schiphol Airport Annual Report
Numerous third-party agencies provide ESG scores for companies, primarily intended as a comparison guide for investments. The data collected by these agencies is typically available as both a report and a data feed. In order to understand how your company reporting and disclosures are interpreted, it is vital to obtain and audit a sampling of these reports for your company. (Most rating agencies allow for some level of company input or feedback to improve or clarify disclosed data, which in turn impacts the scoring.)
IMPORTANT NOTE: Even if your company hasn’t reported ESG data, it’s still possible that ESG rating agencies have gathered data and “scored” your company. Monitoring should be instituted to track potential scoring reports and reputation impact.
Currently, there’s a lack of standards when it comes to ESG reporting. Hundreds of ESG frameworks exist to help guide companies in standardized report development.
There are 600+ ESG reporting standards across the globe.
While ESG disclosure regulation seems to be in the works across many countries worldwide, companies still have a lot of flexibility when it comes to selecting what to report and how to report it.
Corporations seeking direction on reporting for investor stakeholders should look to their respective stock exchange ESG report guidance:
ESG reports are time and resource-intensive. Be sure to understand the prerequisites, timing deadlines, preparation steps and resources needed before you begin.
Before you can engage the reporting process, the following must be completed:
With prerequisites completed, it’s time to evaluate when and how you’ll need to communicate ESG data.
Preparing an ESG report might take 3 to 6 months, so planning is critical to meet deadlines. The first report is always the most time intensive, so buffer accordingly.
The safest approach for ESG report timing is to publish with annual financial data.
Timing Considerations:
Annual reports are typically due within a few months of fiscal year financial close, though this varies by U.S. state. Current disclosure regulations are aligning to match deadlines for annual financial reports. (The proposed SEC climate disclosure rule will require reporting ESG data with annual financial reports on form 10-K.) Standalone ESG reports in countries with no regulations could technically be published at any time.
We recommend aligning ESG reports with financial report timing to make it easier for future report timeframe/data comparisons and anticipated expansion of disclosure regulation requirements.
Report areas requiring notable time or resource effort:
Larger organizations naturally take longer to collect data from all their value chains.
From a project management standpoint, ESG reporting is a complex endeavor. Below are 10 steps to guide ESG report creation:
| OVERSIGHT | CONTENT | DESIGN |
|---|---|---|
|
|
|
Various resources are needed to complete the ESG reporting process. For example, companies will need financial or business data analysts to help compile, analyze and audit ESG data.
Additional resources include content writers, graphic designers, and photographers to assemble and design the actual report. These experts will ensure the ESG report is simple and enjoyable to read instead of being a long list of data points and text.
We reviewed popular ESG reports across 8 different industries. A summary of stand-out report features is noted below. (Click the company name to jump down to a detailed analysis of their report.)
| COMPANY | STAND-OUT REPORT FEATURE | |
|---|---|---|
 |
Trane Technologies ESG Report |
|
 |
Bank of America ESG Report |
|
 |
Walmart ESG Report |
|
 |
Amazon ESG Report |
|
 |
Microsoft ESG Report |
|
 |
Pfizer ESG Report |
|
 |
Coca-Cola ESG Report |
|
 |
DFW Airport ESG Report |
|
 |
Schiphol Airport Annual Report |
|
 |
Trane Technologies ESG Report 2021 |
What to Notice: Trane offers both a web and PDF version of their ESG report. It has very simple organization with just 7 sections for an extra-large report. They open with a letter to shareholders and follow with an annual milestone timeline infographic (page 7) demonstrating progress. (It’s a 2021 report, and the timeline goes from 2010 to 2022.)
Trane highlighted ESG scores and recognition under “Awards & Rankings” (pages 12-13) – with so many third-party accolades it takes up two pages! UN Sustainable Development Goals (summarized on pages 17-18) are called out throughout the report, but interestingly listed separately from frameworks. Trane devoted an entire section to products discussing integrated ESG strategy. The report PDF is optimized for usability and SEO (search optimization) with hyperlinks to respective report sections and Trane web pages.
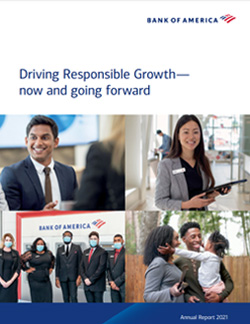 |
Bank of America Annual Report 2021 (PDF) |
What to Notice: Bank of America includes relevant ESG highlights inside their annual report starting around page 35. They have an extensive section on “Human Capital Management.”
On page 53 they detail over 70 awards relevant to ESG. (Note: Featured awards don’t have to be ESG-specific, so long as they are ESG-relevant like “Best Places to Work.”) WEF Stakeholder Capitalism Metrics (page 54) and SASB (page 61) are the frameworks detailed in their integrated annual report.
Additional Standalone ESG Reports:
Note: The Bank of America CEO, Brian Moynihan, chairs the World Economic Forum (WEF) International Business Council (IBC) and partnered closely on development of the WEF Stakeholder Capitalism Metrics. Bank of America is also a signatory member of the United Nations Global Compact (UNGC) since 2016, so it’s no surprise that these frameworks were chosen to guide their reporting efforts.
 |
Walmart ESG Report 2022 |
What to Notice: Walmart created both a website and a PDF for their report. Their fiscal year progress is summarized (pages 6-7) in a 2-page, easy to read infographic. ESG priorities (page 13) are neatly summarized. They used “Opportunity,” “Sustainability,” “Community,” and “Ethics & Integrity” as their 4 themes in place of “Environmental,” “Social,” “Governance.” Excellent visuals and quality Walmart-specific photography are used throughout with an overall pleasant text-to-visual balance.
No framework index or assurance letter is included in the PDF. However, the website does include reporting data with respective indexes. As a result, their PDF is only 50 pages; about half that of other reports reviewed.
 |
Amazon Sustainability Report 2021 (PDF) |
What to Notice: Amazon’s ESG report design uses landscape layout and includes page-top navigation links to major report sections. Although it is named as “Sustainability Report,” they use “Environmental”, “Social”, and “Governance” sections for easy peer comparison. The introduction (page 2) calls out symbols for hyperlinks as well as common abbreviations.
Most page content is presented in small consumable chunks (quality web writing) and there’s a sufficient amount of Amazon-specific photography that possible stock photos don’t look “stocky.”
The appendix includes a framework “index” with keyword hyperlinks (to a section within the report or on the website) to respective metric details. The TCFD section (page 90) includes disclosure required content (i.e., governance, approach, metrics/targets, risks/opportunities) along with tabular summary of climate-related risks and opportunities.
 |
Microsoft Environmental Sustainability Report 2021 (PDF) |
What to Notice: The scope of Microsoft’s primary ESG report is environmental. (They additionally published the Microsoft UN Sustainable Development Goals Report 2022 (PDF), which covers the full scope of ESG, but doesn’t follow the typical content structure of an ESG disclosure report. Together these reports comprise the data broad stakeholders seek.
The report design uses landscape orientation and color-coding for sections which aid usability an on-screen viewing. Report content includes disclosure of a substantial number of environmental metrics.
 |
Pfizer ESG Report 2021 (PDF) |
What to Notice: Pfizer uses a unique “full screen” (4:3 ratio) for their page size which is slightly better than 3:4 for on-screen reading and still accommodates easy printing. Report content structure is simple with clear “Environmental,” “Social,” “Governance” sections. They use interesting shape and helpful E-S-G color-coding for visualizing priorities (page 11, 13) and their materiality matrix (page 12.) Integration with their Enterprise Risk Management (ERM) system is nicely detailed. Before diving into E-S-G section, they present an “Impact Stories” section (page 14) and 3 detailed stories.
The appendix includes a framework index (page 62) with clear hyperlinks to disclosure locations. The GRI index includes a nice integrated visual of UN SDGs. An independent assurance statement is also provided (page 82.)
Note: There is also the Pfizer Annual Report 2021 (PDF) which includes a 2-page section (pages 48-49) that summarizes ESG commitments and 2021 ESG progress highlights with an infographic. Then it provides links to the ESG report. (It’s not enough to qualify as a fully "ESG integrated report,” but they minimally connected the dots.)
 |
Coca-Cola ESG Report 2021 |
What to Notice: The Coca-Cola Company created both a website and PDF for their 2021 ESG report data. The report opens highlighting their mission statement which naturally connects to ESG. The PDF is creatively laid out like a magazine with callout quotes and statistics alongside relevant infographics and Coca-Cola-specific photography – no stock photos – on EVERY page which makes it pleasant and casual to read. The report's main sections are at the top of every page for easy navigation. Coca-Cola does NOT use “Environmental”, “Social”, and “Governance” sections, which might make peer comparison of data more challenging.
The report uses landscape orientation which beautifully fits full-width on-screen – convenient for usability and for presentations.
Four “Spotlight Stories” are included to provide depth to their ESG initiatives with diverse business partners. Their materiality matrix is included (page 18.)
An external audit of “Selected Sustainability Indicators” was conducted by Ernst & Young with their assurance statement included on page 80.
Interestingly, they created a separate 25-page document, Coca-Cola ESG Reporting Frameworks 2021 (PDF), to index framework use with hyperlinks that go back to the actual report PDF.
 |
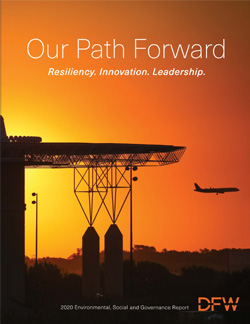
DFW Airport ESG Report 2020 |
What to Notice: DFW International Airport created both a website and interactive PDF (“flip book”) for their 2020 ESG report data. The contents have 4 major sections – including “Environmental”, “Social”, and “Governance.” 2020 highlights (pages 10-11) are presented as color-coded infographics for E-S-G alongside awards for the year. Each ESG initiative section begins with summarized performance statistics, icons for respective UN SDGs, and a listing of relevant awards. (The section-specific awards help build more trust throughout the report, especially for stakeholders that don’t begin at page 1.)
The feature “Roadmap to Zero Carbon” (pages 22-23) is loaded with information and demonstrates brave transparency regarding carbon emission pollution challenges; the infographic map helps visualize opportunities across the property. (DFW received a “UN Climate Change Award” as part of this initiative.)
Ownership and governance (pages 60-61) include board photos along with infographics to visualize diversity of gender, ethnicity, and industries represented.
GRI Index is included with hyperlinks for stakeholders to quickly access metrics and content pertinent to their interests.
 |
Schiphol Annual Report 2021 |
What to Notice: Schiphol Group created both a website and PDF for their 2021 annual report. The structure of this integrated report is quite similar to an ESG standalone report with chapters for goals (“Our Why”), performance, governance, and socio-economic accountability. Financial statements don’t begin until page 130 in this gigantic 231-page report. Although this had the most pages for reports that we reviewed, it was actually the smallest file size. (Compression of graphics and content did not impact the quality and makes mobile viewing much easier and faster for stakeholders.)
Schiphol includes a comprehensive “value creation” infographic that identifies and connects their stakeholders, business areas, vision, and performance indicators; the infographic blocks link to pages of the report with more details. The stakeholder audience identification and featured UN SDGs are seamlessly integrated.
The “Governance” section goes into great detail. Their “Supervisory Board” (page 83) pages include a detailed chart (page 86-87) mapping board member composition, attendance, and relevant fields of knowledge. Accountability for material issues (page 98) and enterprise risk management (page 105-106) is visually charted for simple reading.
An entire section for sustainability and ESG (page 108-129) is integrated into the annual report which includes a materiality assessment infographic (page 110-111), UN SDG performance (page 112), a GRI index (page 113-117), and multiple independent assurance letters. A materiality matrix (page 22) was provided up front as part of business strategy. UN SDGs are integrated nicely throughout the report.
After helping prepare and evaluating dozens of ESG reports, we’ve compiled the following best practices to guide creation and optimization of your ESG reports.
Developing a quality ESG report is something worth celebrating. It takes serious time and effort to translate a company’s ESG initiatives into a format that all stakeholders can read, understand, and enjoy. Because of this effort, special recognition is available for ESG reports that go above and beyond the standard report.
Evaluate ESG reporting awards and winners; it will help you:
Companies can submit their ESG reports (and initiatives) for award consideration to organizations such as:
Submission deadlines typically range from early summer to fall with winners announced in fall or early winter.
Awards vary based on report type, company size, report format/creativity, reporting framework, performance/impact in individual E-S-G areas, first-time reports, and performance improvement.
ESG report award categories include:
Check out these sites for reports that recently won awards:
Things to look for in award-winning reports:
Whether you are creating basic reports for regulation compliance or looking to optimize reports for stakeholder usability or award recognition, our ESG consultants are here to guide your reporting efforts and provide independent data assurance. Reach out for a free consultation today!
From risk assessments and framework selection to report guidance and independent assurance of data, our team can assist your ESG strategy and efforts.