
Dynamics GP includes a variety of reporting tools to get business information out of GP. One of the easiest to use is SmartLists, and its companion, Refreshable Excel Reports. Read on to learn about the Dynamics GP fixed assets depreciation projection query.
SmartLists are based on SQL Views and make current information from your ERP system instantly available. Dynamics GP 2015 introduced a feature to allow you to make your own SmartLists using SmartList Designer and publish them to Refreshable Excel Reports.
To be publishable to Refreshable Excel Reports, the new SmartList must be based on a SQL query, not one or more SQL tables.
Here's an example of how you might create your own SQL View that can be used in Refreshable Excel Reports. For this example, I used the Fixed Assets Depreciation Projection data.
Take a peek at the step-by-step process:
Open SQL Server Management Studio to create a new SQL View. Right click on the "Views" folder and select new.
These are the tables I used. FA41900 is the main table with the depreciation projections. I added the other two to make available additional information to help the user identify the data.

These are the fields selected for this particular example, but it's possible to select fewer or more.
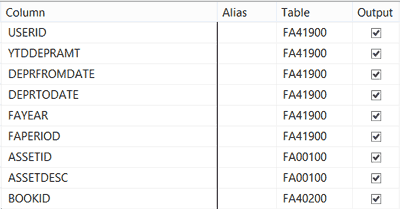
Save the query.
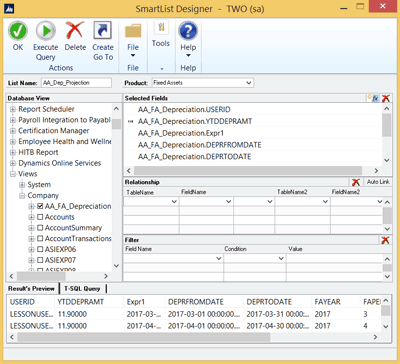
Open SmartList Designer and create a new SmartList.
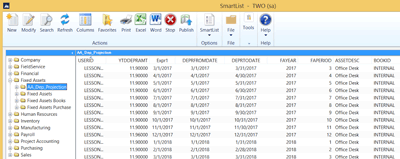
View the new SmartList in SmartLists and select "Publish" to move this to Refreshable Excel Reports.
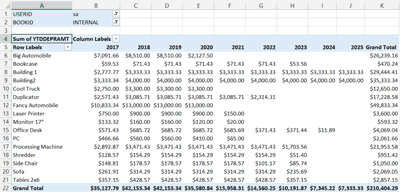
In Refreshable Excel Reports, open up the new report and view in Excel. If desired, insert the data into a pivot table. In this specific example, I used the USERID and BOOKID to filter the data.
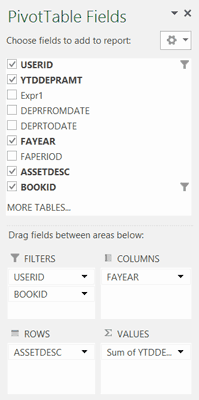
And here's the result:
This quick video visually highlights the process for the Dynamics GP fixed assets depreciation projection query as well. Learn more about Dynamics GP and check out other posts for more GP tips and tricks.


